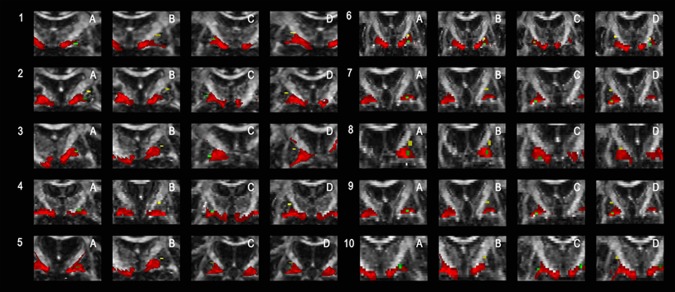
Figure 1.

Shows the topographic relationship of the pallidothalamic tracts, as obtained by probabilistic tracking, and the DBS electrodes for each patient. Activated DBS electrodes are marked in green, reference electrodes in yellow and the pallidothalamic tracts in red. [Color figure can be viewed at http://wileyonlinelibrary.com]
