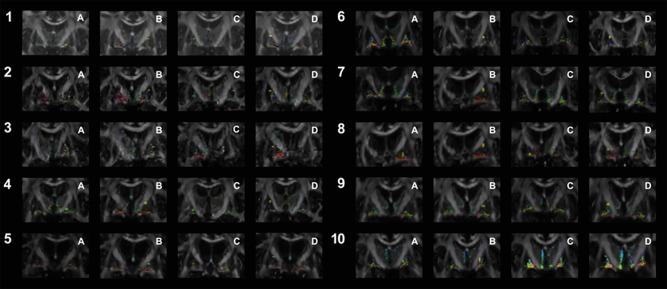
Figure 2.

Shows the topographic relationship of the pallidothalamic tracts, as obtained by streamline tracking, and the DBS electrodes for each patient. Numbering and colour codes are as in Figure 1. [Color figure can be viewed at http://wileyonlinelibrary.com]
