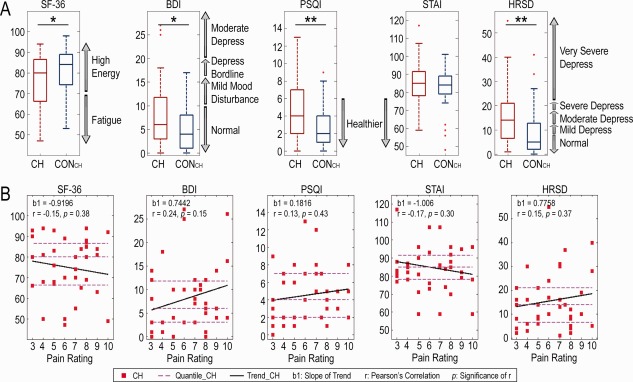
Figure 1.

Statistical distribution of psychometric results for the CH and CONCH groups (Supporting Information Table) and the correlations between psychometric scores and pain ratings for CH patients. (A) Box plots of psychometric results with their diagnostic criteria (gray arrows on the right side of box) of the patients (red boxes) and controls (blue boxes). *P < 0.05; **P < 0.01. (B) Scatter plots of psychometric measures as a function of self‐reported subjective pain ratings (0–10 scale) in CH patients. Thick black lines: linear regression results with the slope b1; dashed magenta lines: quartiles on the vertical axis. [Color figure can be viewed at http://wileyonlinelibrary.com]
