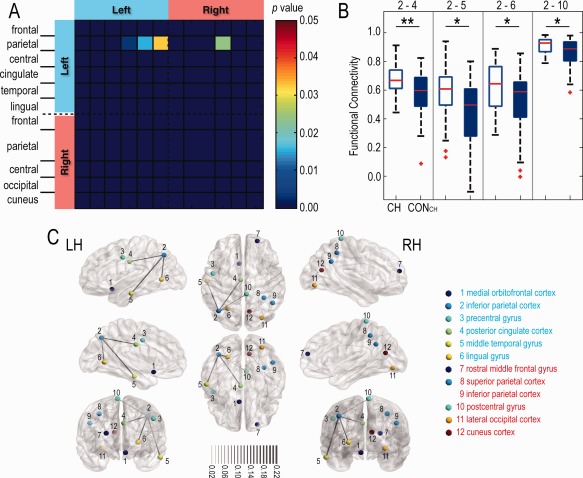
Figure 6.

Matrix plots and 3D visualization of ROI pairs with rsFC differences between CH and CONCH groups. (A) Four ROI pairs with significant group difference in rsFC. (B) Box plots of rsFC distributions for each group for those four ROI pairs. Red lines indicate medians; top and bottom blue lines indicate 75% and 25% quartiles; error bars (whiskers) show SDs; outliers are plotted as red crosses. *P < 0.05; **P < 0.01. (C) Colored nodes represent ROI seeds with same color scheme representing ROIs within the same lobe (e.g., frontal and parietal cortices). Inter‐nodal lines are weighted to reflect magnitude of mean correlation coefficient values between the groups. The four ROI pairs (2–4, 2–6, 2–5, and 2–10) with significant differences in correlation coefficients between the two groups (Fig. 6A) are linked with lines. LH and RH: left and right hemispheres. [Color figure can be viewed at http://wileyonlinelibrary.com]
