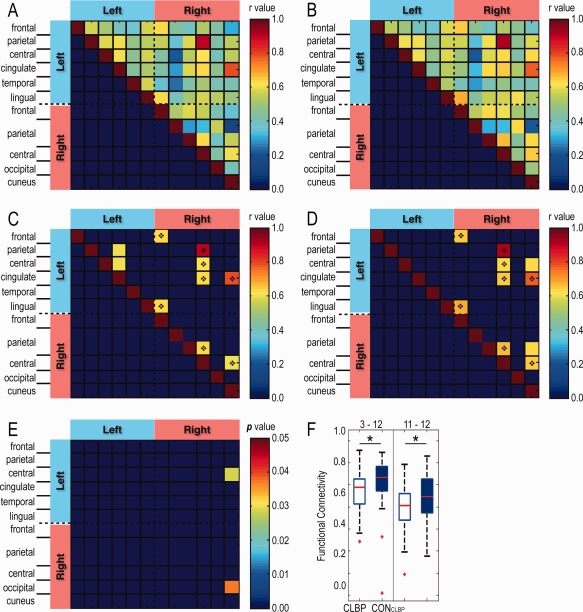
Figure 7.

Pairwise rsFC between CLBP patients and their controls CONCLBP (49 pairs) using the same ROI seeds as in Fig. 6. Matrix plots of mean rsFC in (A) CLBP and (B) CONCLBP with their top 10 values shown, respectively, in (C) and (D). Shared pixels are indicated by the diamond. (E) rsFC of left precentral gyrus (left premotor cortex) – right cuneus cortex (right V1 cortex) (3–12) and right lateral occipital cortex (right V2 cortex) – right cuneus cortex (right V1 cortex) (11–12) differed between the two groups. (F) Box plots of the group FC (r value) distributions for ROI pairs of 3–12 and 11–12. Red lines indicate medians; top and bottom blue lines indicate 75% and 25% quartiles; error bars (whiskers) show SDs; outliers are plotted as red crosses. *P < 0.05, two‐sample double‐tailed t‐test. [Color figure can be viewed at http://wileyonlinelibrary.com]
