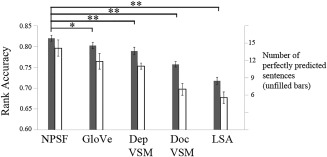
Figure 3.

Comparison of sentence activation prediction accuracies using different types of predicting semantic features. Error bars indicate standard errors. The P values indicate the comparison between the mean rank accuracy using each of the four alternatives versus the NPSF‐based model in paired‐sample t tests over 7 participants. **Two‐tailed P < 0.01; *two‐tailed P < 0.05.
