
Figure 1.
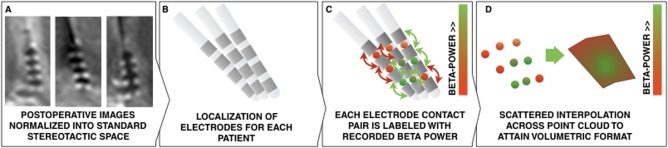
Overview of electrode mapping using the example of beta power. A) Normalization of postoperative images into MNI space. B) Localization of electrode placement using Lead‐DBS. C) Each electrode contact pair is labeled with its according beta‐power. This generates a point‐cloud of data values in three‐dimensional (anatomical) space. D) By estimating a scattered interpolant across data points, a slice visualization or 3D isovolume visualization (see Fig. 4) becomes feasible. [Color figure can be viewed at http://wileyonlinelibrary.com]