
Figure 2.
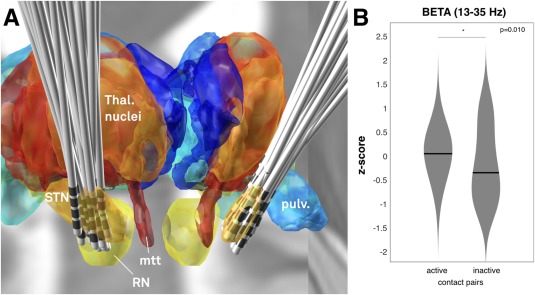
A) Placement of electrodes visualized in context of a 3D representation of the Morel atlas in MNI space. The ICMB 152 2009b nonlinear template is visualized in the background. STN: subthalamic nucleus. RN: red nucleus. mtt: mammillo‐thalamic tract. pulv.: Pulvinar. B) Comparison of z‐scored beta power recorded from active contact pairs in patient‘s long‐term DBS settings (left violin plot) versus inactive contact pairs (right violin plot). [Color figure can be viewed at http://wileyonlinelibrary.com]