
Figure 7.
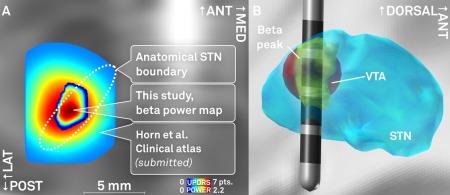
A: Comparison of the spatial location of peaks in a probabilistic atlas that is based on mean UPDRS hemibody score improvements [Horn et al., submitted; peak coordinates x = ±12.4, y = −14.6, z = −8.8 mm] and the beta power atlas estimated in this study (x = ±12.0, y = −14.4, z = −8.6). Axial slice cut at z = −8.7 mm. B: Exemplary use‐case of the probabilistic beta power atlas estimated in this study. A DBS lead is modeled within the STN. After localization, stimulation parameters are tuned in a way to maximize the overlap between volume of tissue activated (VTA, red) and the beta power hot‐spot (yellow). In this example, a low amplitude of 0.8V at 1kΩ impedance is modeled at the second dorsalmost contact using the heuristic VTA‐model developed by Mädler and Coenen [2012]. This panel illustrates the concept of VTA‐modeling based on an electrophysiological atlas and is not based on actual patient data. [Color figure can be viewed at http://wileyonlinelibrary.com]