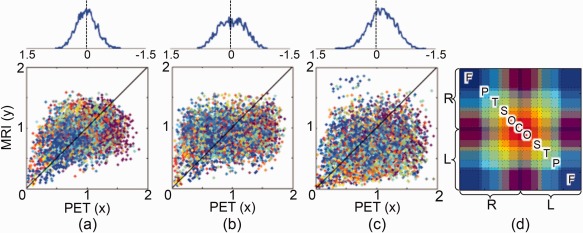
Figure 4.

The DD plot of (a) ADHD, (b) ASD and (c) CON. The horizontal and vertical axes represent the distances (1‐corr) of edges on the networks of PET and MRI, respectively. Each dot is an edge and the color of edge is shown in (d). The abbreviations F, P, T, S, O, and C represent frontal, parietal, temporal, subcortical, occipital, and cerebellar regions. R and L represent right and left hemispheres. The black line represents y = x . The distance from dots to y = x is estimated and its histogram is plotted above each DD plot. [Color figure can be viewed at http://wileyonlinelibrary.com]
