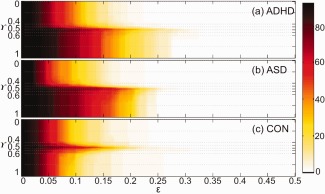
Figure 5.

β 0‐plots between PET and MRI of (a) ADHD, (b) ASD, and (c) CON on the ∈ − γ plane. The vertical axis represents a mixing ratio γ and the horizontal axis represents a new threshold ∈ on the projection line with mixing ratio γ The color in β 0‐plot in (a,b) is varied according to the zeroth Betti number β 0 between 1 and the number of nodes P = 93. When β 0 becomes larger, the color changes from white to dark red as shown in the right colorbar. [Color figure can be viewed at http://wileyonlinelibrary.com]
