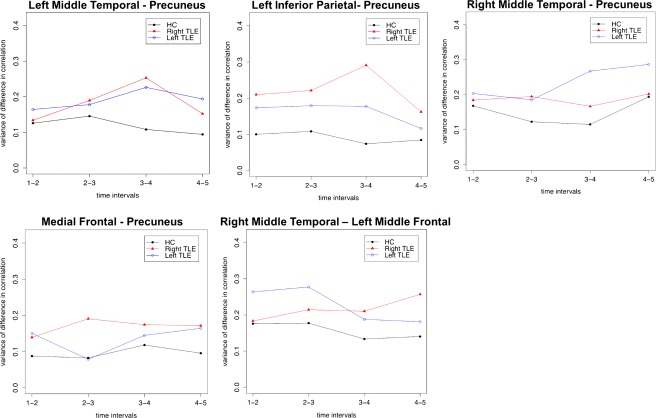
Figure 4.

The variance of differences in correlation from one time interval to the next, var (ρ t − ρ t‐1), for pairs showing significant differences in instability. Note, the y‐axis plots variability across the time windows for each group. [Color figure can be viewed at http://wileyonlinelibrary.com.]
