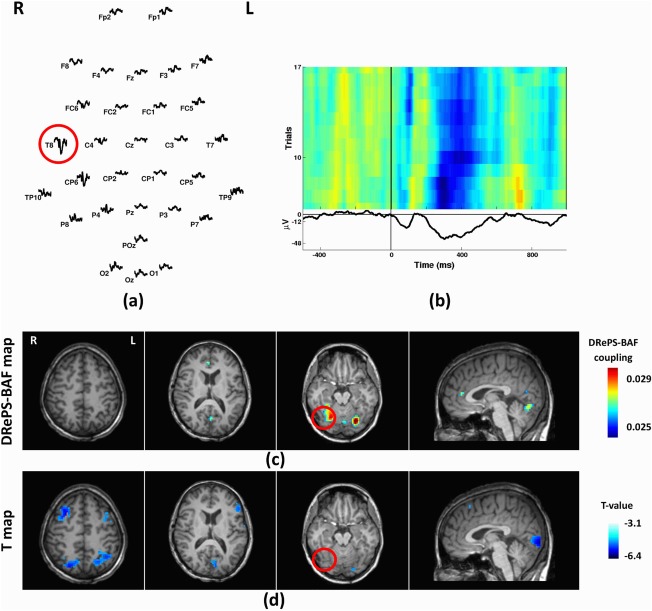
Figure 11.

Analysis results of Patient 7: (a) Spatial distribution of the mean spikes over all EEG electrodes, (b) Average IED waveform at T8 as the target electrode, (c) DRePS‐BAF coupling map, (d) Standard EEG‐fMRI T‐map. All functional brain maps are overlaid onto the patient's own anatomical T1 images. The suspected seizure onset zone as determined by standard clinical investigation (see Table I) has been highlighted by red circles on the brain maps. The DRePS‐BAF map shows suprathreshold voxels superior and lateral to the previous surgery (suspected seizure focus). The GLM map shows wide‐spread decreased BOLD activity across bilateral occipital and frontal cortices. Trending T‐values (>2.3) are also observed near the suspected epileptic region, but these voxels do not survive cluster correction. [Color figure can be viewed at http://wileyonlinelibrary.com]
