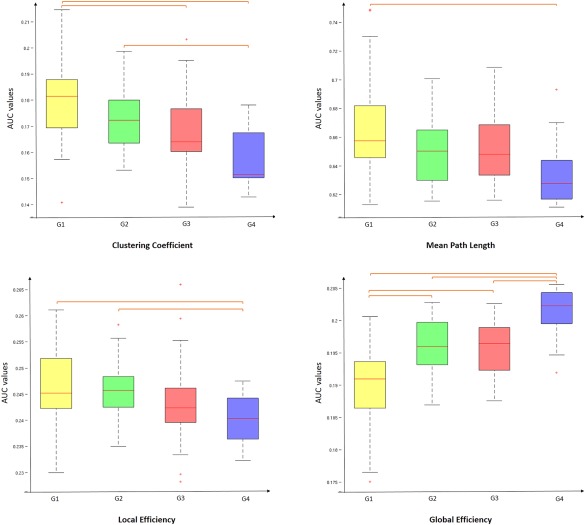
Figure 2.

Boxplot of mean AUC network metrics values for each group. Between‐group differences were assessed by one‐way ANOVA and post‐hoc tests (P < 0.01). AUC value corresponds to the area under the curve in plotting the network metric values as a function of the threshold values applied to the connectivity matrix. [Color figure can be viewed at http://wileyonlinelibrary.com]
