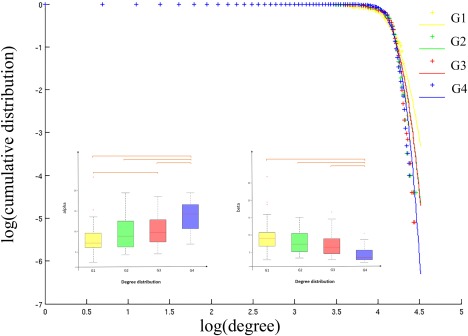
Figure 3.

Degree distribution. Plots of the log of the cumulative distribution of degree vs the log of degree, for each patients group. Cross points are the real data and lines are the estimated fitting. Boxplot of the distribution parameters and for each group. Between‐group differences were assessed by one‐way ANOVA and posthoc tests (P < 0.01). [Color figure can be viewed at http://wileyonlinelibrary.com]
