. 2019 Oct 22;127(10):107008. doi: 10.1289/EHP5204

Figure 2.

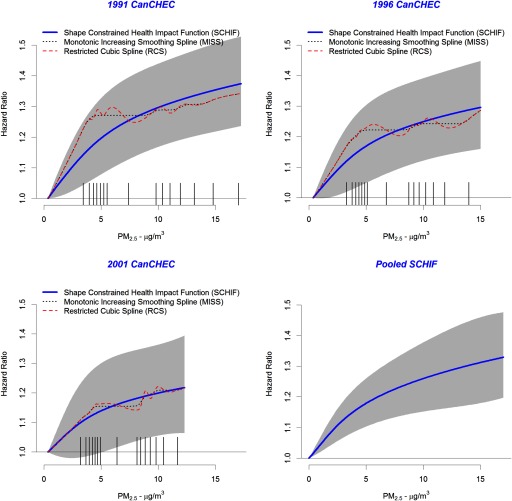
Figure 2 comprises four graphs. The first (1991 CanCHEC), second (1996 CanCHEC), and third (2001 CanCHEC) graphs plot hazard ratio (ranging from 1.0 to 1.5 in increments of 0.1) (y-axis) across PM sub 2.5 (ranging from 0 to 15 micrograms per cubic meter in increments of 5) (x-axis) for the shape constrained health impact function (SCHIF), monotonically increasing smoothing spline (MISS), and restricted cubic spline (RCS). The trend is generally shown to be rising in all the three graphs. The fourth graph (pooled SCHIF) plots hazard ratios (ranging from 1.0 to 1.5 in increments of 0.1) (y-axis) across PM sub 2.5 (ranging from 0 to 15 micrograms per cubic meter in increments of 5) (x-axis) for the pooled shape constrained health impact function (SCHIF).

Shape Constrained Health Impact Function (SCHIF) (solid blue line), monotonically increasing smoothing spline (MISS) (dotted black line), and restricted cubic spline (RCS) (dashed red line) predictions by particulate matter with aerodynamic diameter 2.5μm (PM2.5) concentration and Canadian Census Health and Environment Cohort (CanCHEC) (1991, 1996, and 2001). Hazard ratio predictions based on pooling cohort-specific SCHIFs are also presented. Uncertainty bounds are displayed as gray shaded area. Tick marks on PM2.5 axis represent the 15-RCS knot locations.