. 2019 Oct 22;127(10):107008. doi: 10.1289/EHP5204

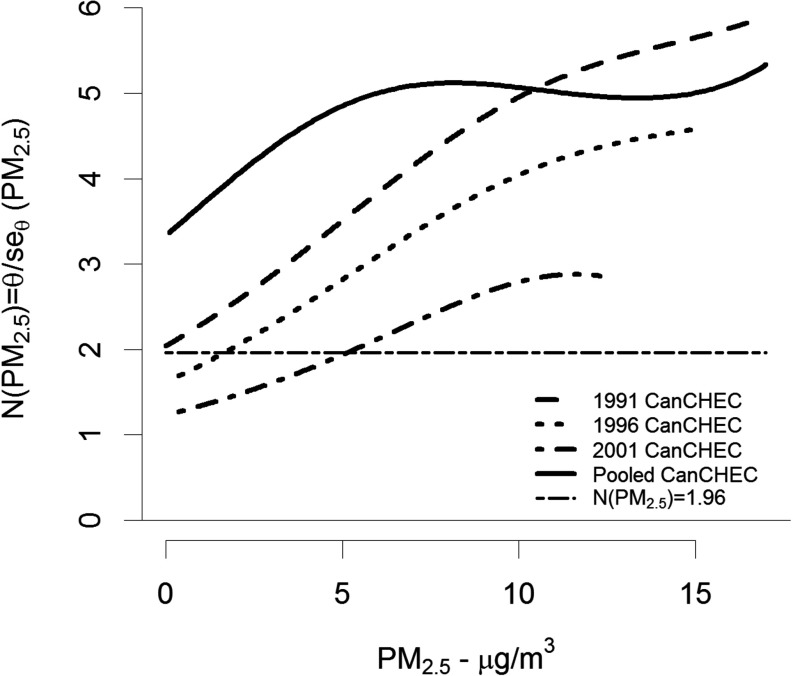
Figure 3.

Figure 3 is a line graph plotting N open parenthesis PM sub 2.5 close parenthesis equals theta divided by s e sub theta open parenthesis PM sub 2.5 close parenthesis (ranging from 0 to 6 in unit increments) (y-axis) across PM sub 2.5 (ranging from 0 to 15 micrograms per cubic meter in increments of 5) (x-axis) for the 1991 CanCHEC, 1996 CanCHEC, 2001 CanCHEC, pooled CanCHEC, and N open parenthesis PM sub 2.5 close parenthesis equals 1.96. The trend for the first three elements is shown to be rising. The trend for the fourth element is stable, running parallel to the x-axis.

Signal-to-noise ratio, N(z)=θ/seθ(z), by concentration and Canadian Census Health and Environment Cohort (CanCHEC; 1991, 1996, 2001). Dashed-dotted horizontal black line represents a ratio of 1.96.