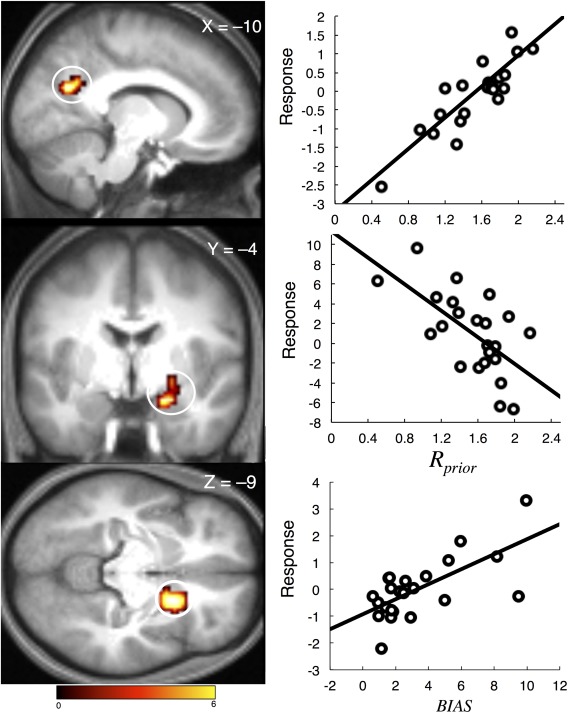
Figure 4.

Results of the multiple regression analysis. Activity (beta values, in arbitrary units) in the RSC (top) and hippocampal/amygdala complex (middle) while reproducing distance covaries with our index of the reliance of individual subjects on the prior distribution of reproduced distances (R prior), independent of the individual mean BIAS values. Conversely, activity in the right putamen (bottom) while encoding distance covaries with our index of general offset from the presented distances (BIAS). At right, the correlation from the peak voxel for each structure is presented, for illustrative purposes only—no additional statistical analyses have been run. Activation is displayed at P < 0.001 peak level, P < 0.05 corrected cluster level. Color scale indicates t‐score value. Activation is displayed on an averaged anatomical scan. [Color figure can be viewed in the online issue, which is available at http://wileyonlinelibrary.com.]
