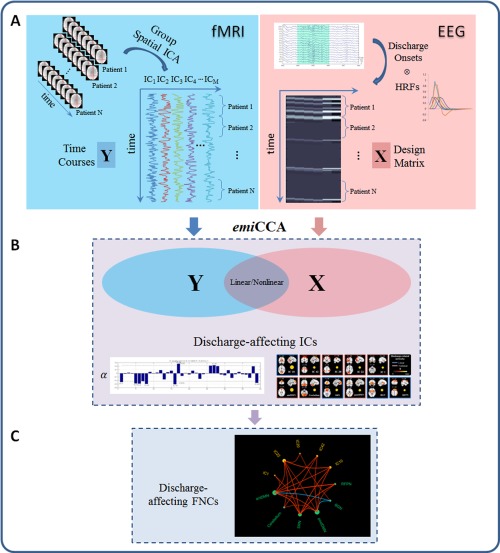
Figure 1.

The framework of discharge‐affecting network analysis using emiCCA. A: For fMRI data, group ICA was first applied to extract the spatiotemporal features of the fMRI data; then, the IC time courses were concatenated across JME patients and defined as dataset Y. For EEG data, the onsets of GSWDs were first identified by neurologists. Then, the dataset X was defined by a design matrix containing the onsets of GSWDs, which were convolved with 4 SPM canonical HRFs (peaking at 3, 5, 7 and 9 s), 1 Glover HRF and 1 single Gamma HRF. B: emiCCA was applied to identify the linear and nonlinear discharge‐affecting components with weights (α) exceeding the 1.5 standard deviations of weight values corresponding to the significant maximal information eigen coefficients (MIECs). C: The maximal time‐lagged correlation method was used to examine the possible functional network connectivity between those discharge‐affecting networks identified by emiCCA. [Color figure can be viewed in the online issue, which is available at http://wileyonlinelibrary.com.]
