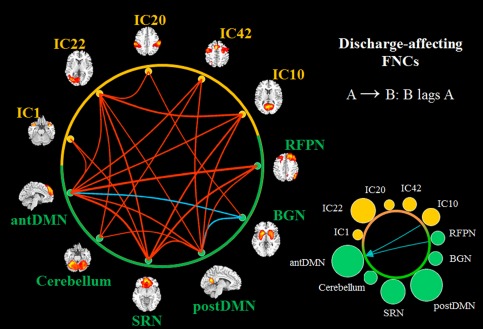
Figure 3.

Discharge‐affecting FNCs in JME patients (P < 0.05, FDR‐corrected). The lines show the significant positive (red) and negative (blue) correlation connections in JME patients from the 55 possible correlation combinations. The size of circles in the bottom right represents the degree of the node in functional network connectivity (containing positive and negative), and the green color represents the networks, which are also the resting‐state networks. The lags, which are the amount of delay between component time courses, are also shown on the right (P < 0.05). A → B: component B lags component A by some calculated seconds. [Color figure can be viewed in the online issue, which is available at http://wileyonlinelibrary.com.]
