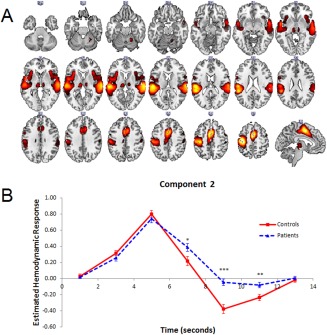
Figure 3.

(A, B) (A) Dominant 10% of component loadings for Component 2 Response Activation (blue/green = positive loadings, threshold = 0.09, max = 0.19; no negative loadings passed threshold) and Component 2 (blue/green = positive loadings, threshold = 0.04, max = 0.11; no negative loadings passed threshold). Overlapping regions are displayed in pink/white. Montreal Neurological Institute Z‐axis coordinates are displayed. (B) Mean FIR‐based predictor weights for Component 2 plotted as a function of poststimulus time. * = P < 0.05, ** = P < 0.005, *** = P < 0.001. [Color figure can be viewed at http://wileyonlinelibrary.com]
