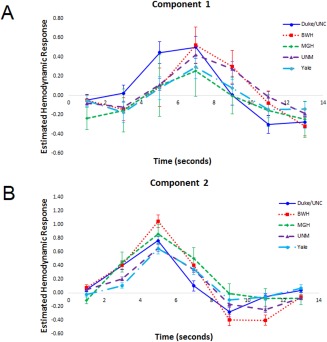
Figure 4.

(A, B) (A) Mean finite impulse response (FIR)‐based predictor weights for Component 1 (Response Modulation) plotted as a function of site. (B) Mean FIR‐based predictor weights for Component 2 (Response Activation) plotted as a function of site. [Color figure can be viewed at http://wileyonlinelibrary.com]
