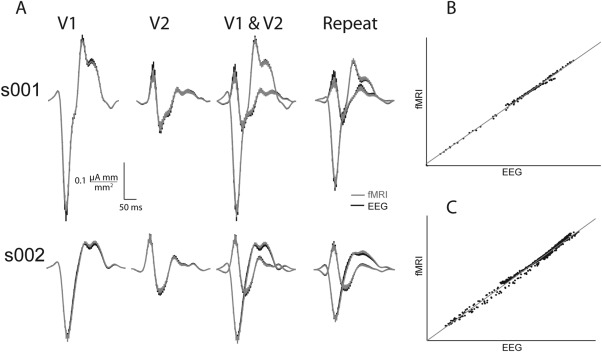
Figure 2.

Visual evoked currents (VEC) decomposed with EEG or fMRI retinotopy constrained source estimation (RCSE). A, V1 and V2 waveforms produced with EEG (black) RCSE are similar and within the error of fMRI‐constrained estimation (gray). Repeat depicts waveforms generated using RCSE and the second EEG experimental repeat. B, s001 fMRI versus EEG waveforms using two repeats, r (238) = 0.9998, P < 0.0001. C, s002 fMRI versus EEG waveforms using eight repeats r (598) = 0.996, P < 0.0001.
