Figure 5.

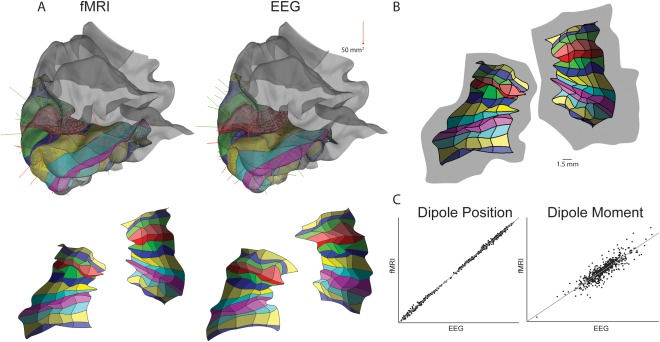
Retinotopic layout (RL) and final dipole comparison between EEG and fMRI Retinotopy Constrained Source Estimation (RCSE). A, Top, RL in fMRI versus EEG‐only on 3D cortical volume of s002 left hemisphere. Both methods place the V1 within the calcarine sulcus and wrap the RL similarly around the occipital pole. Bottom, RL spread on 2D flatmap of cortex. B, Users can place the RL's random control points approximately 2 mm away from their optimal position (gray area) and the optimization will still be successful. C, Dipole positions and moments of EEG versus fMRI RCSE correlate well with each other: Position r (598) = 0.99,P < 0.0001, mean 2mm SD(1.4), Moment (M), r (598) = 0.89,P < 0.0001).
