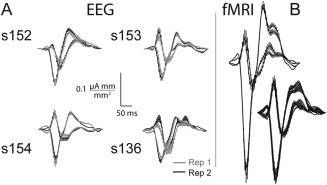
Figure 6.

V1 and V2 visual evoked currents decomposed with retinotopy constrained source estimation (RSCE). A, Four subjects' visual evoked currents (VECs) with EEG‐RCSE. Rep 1. is the EEG from the visual evoked potential (VEP) repeat used to create the retinotopic layout (RL). Rep 2. Depicts source currents from the second repeat of the VEP experiment, based on the model created with Rep 1. The VECs produced are similar in amplitude and timing. s136 is an example of a deviant waveform due to noisy EEG. B, Depiction of repeat variation using fMRI‐RCSE: two repeats for left VEC, eight repeats for right VEC.
