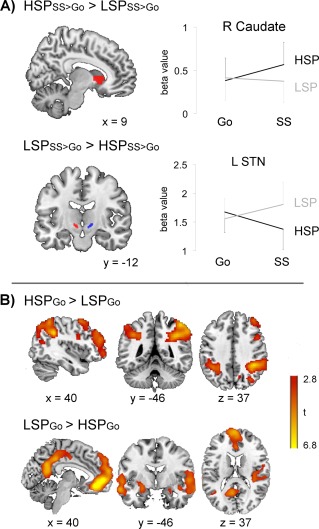
Figure 4.

(A) Effect of stop‐signal probability on stop success activity. ROI analysis. Left: ROIs overlaid on a standard brain. Right: Increased activation was observed in right caudate head during successful stopping for high (HSP) versus the low (LSP) stop‐signal probability condition whereas the opposite was observed for the subthalamic nucleus (STN). Plots show the average beta values of all voxels in the ROI (± standard error). (B) Effect of stop‐signal probability on Go trial activation. Left: Brain regions showing more activation on Go trials for HSP than LSP. Right: Brain regions showing more activation on Go trials for LSP than HSP. Whole‐brain analysis, cluster‐level FWE P < 0.05, cluster defining height threshold t > 3.16. [Color figure can be viewed at http://wileyonlinelibrary.com]
