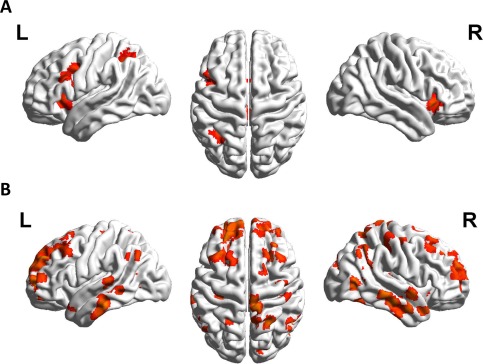
Figure 7.

Panel A shows the comparison of untrained items of the pre‐training session with untrained items of the post‐training session (UT2–UT1), revealing activation in left IPS as well as left middle and inferior frontal areas. Panel B depicts the comparison of to‐be‐trained items of the pre‐training session to untrained items of the post‐training session (TBT–UT2), revealing a large fronto‐parietal network of supra‐threshold clusters including the angular gyrus and the intraparietal sulcus.
