
Figure 1.
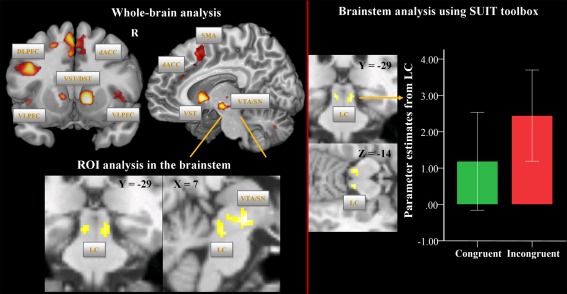
Univariate fMRI analysis: incongruent vs. congruent Stroop task condition. On the upper left side, brain regions are depicted, which show increased BOLD signal during the incongruent vs. congruent condition at the whole‐brain level (voxel‐level: P < 0.001 uncorr., cluster‐level: P < 0.05, FWE corr.). On the lower left side, BOLD activation differences (voxel‐level: P < 0.001 uncorr., cluster‐level: according to the number of expected voxels per cluster k e) are illustrated based on the ROI analysis in the brainstem. The mask image was created using the WFU PickAtlas and comprised the midbrain and the upper brainstem. On the right side, brain regions are depicted, which show increased BOLD signal during the incongruent vs. congruent conditions at the level of the brainstem/cerebellum as preprocessed with the SUIT toolbox and using 4 mm FWHM smoothing (voxel‐level: P < 0.001 uncorr., cluster‐level: according to the number of expected voxels per cluster k e). The box plot shows the parameter estimates for the congruent and incongruent conditions as extracted from the LC cluster. Abbreviations: DLPFC, dorsolateral prefrontal cortex; VLPFC, ventrolateral prefrontal cortex; dACC, dorsal anterior cingulate cortex; SMA, supplementary motor area; VST, ventral striatum; DST, dorsal striatum; VTA/SN, ventral tegmental area/substantia nigra; LC, locus coeruleus.