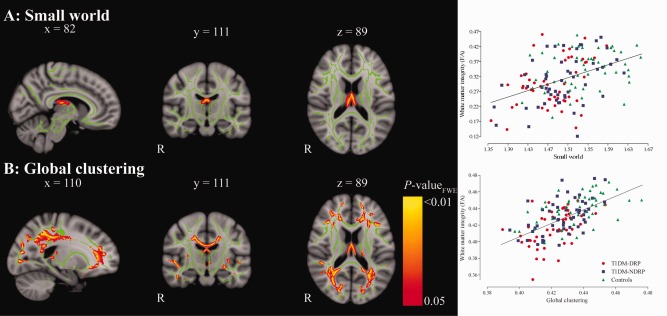
Figure 3.

Schematic representation of the parts of the white matter skeleton that are correlated with small world (A) and global clustering (B), with the corresponding scatter plots. Areas of a statistically significant correlation after FWE‐correction for multiple comparisons are displayed as thickened tracts for visualization purposes. Mean fractional anisotropy value of the significant voxels were extracted and used in the scatterplots. Red circles represent patients with proliferative retinopathy (T1DM‐DRP); blue squares represent patients without proliferative retinopathy (T1DM‐NDRP) and green triangles represent controls. [Color figure can be viewed in the online issue, which is available at http://wileyonlinelibrary.com.]
