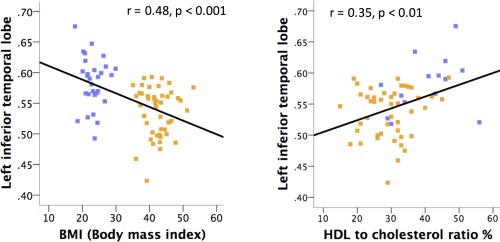
Figure 3.

Linear relationship between grey matter densities, BMI and total cholesterol‐to‐HDL ratio (in the scatter plot, non‐obese subjects appear in dark blue and obese subjects in orange). See Tables 3, 4 and 6 for full report on the correlations between brain tissue densities and metabolic variables. [Color figure can be viewed at http://wileyonlinelibrary.com.]
