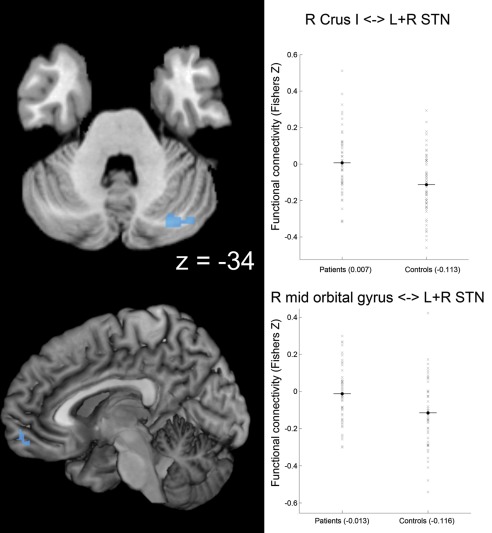
Figure 2.

Attenuated negative coupling with STN in Parkinson patients. Clusters showing a significant PD‐related attenuation of negative coupling (i.e., functional connectivity in patients > controls and functional connectivity negative in controls) with the seed region (i.e., bilateral STN) are marked in cold colors. Coordinates refer to Montreal Neurological Institute space. Surface rendering was performed with MRIcron [Rorden and Brett, 2000]. Scatter plots for right Crus I of the cerebellum (R Crus I) and for right (R) mid‐orbital gyrus show functional connectivity with STN for patients and controls. A conjunction of left and right STN seeds was used for data analysis. [Color figure can be viewed in the online issue, which is available at http://wileyonlinelibrary.com.]
