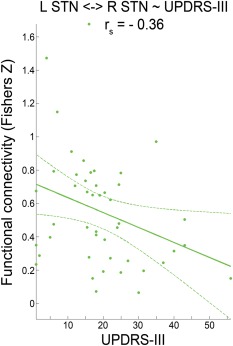
Figure 5.

Correlation of UPDRS‐III motor scores and functional connectivity between left and right STN. Scatter plot shows the individual functional connectivity between left and right STN against Unified Parkinson's disease Rating Scale part III (UPDRS‐III) values across a patient subgroup (n = 46) with available UPDRS‐III data. Linear regression line with 95% confidence interval (dotted lines), as well as r s‐values (Spearman's rank correlation coefficient) are provided. [Color figure can be viewed in the online issue, which is available at http://wileyonlinelibrary.com.]
