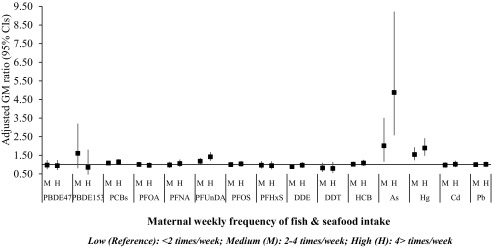
Figure 1.
Adjusted linear regression associations between weekly consumption of fish and seafood and measured levels of contaminants in maternal blood collected during pregnancy (). Models are mutually adjusted for all food groups and for cohort, maternal age, educational level, parity, prepregnancy body mass index, gestational weight gain, active smoking during pregnancy, and year of delivery. Women from KANC and BiB cohorts are not included. Corresponding numeric data are reported in Excel Table S8. As, arsenic; BiB, Born in Bradford cohort; Cd, cadmium; CI, confidence interval; DDE, dichlorodiphenyldichloroethylene; DDT, dichlorodiphenyltrichloroethane; GM, geometric mean; HCB, hexachlorobenzene; Hg, mercury; KANC, Kaunas Cohort; Pb, lead; PBDE, polybrominated diphenyl ether; PCB, polychlorinated biphenyl; PFHxs, perfluorohexane sulfonate; PFNA, Perfluorononanoate; PFOA, perfluorooctanoate; PFOS, perfluorooctane sulfonate; PFUnDA, perfluoroundecanoate.

