
Figure 1.
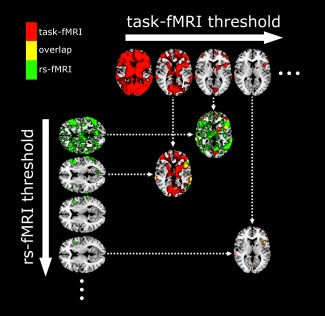
Dice coefficient calculation across multiple thresholds. For each subject, normalized task‐fMRI and rs‐fMRI were thresholded from 0 to 10 at 0.1 increments, and Dice coefficients calculated across all thresholds to generate a 100 × 100 matrix of Dice coefficients. The figure demonstrates brain maps corresponding to four random levels of thresholding on the x (task‐fMRI) and y (rs‐fMRI) axes, and three selected examples of spatial overlap maps as the target of the arrows to demonstrate the contribution of noise in Dice calculation at low thresholds. The ellipses denote the presence of additional thresholds that are not shown. [Color figure can be viewed in the online issue, which is available at http://wileyonlinelibrary.com.]