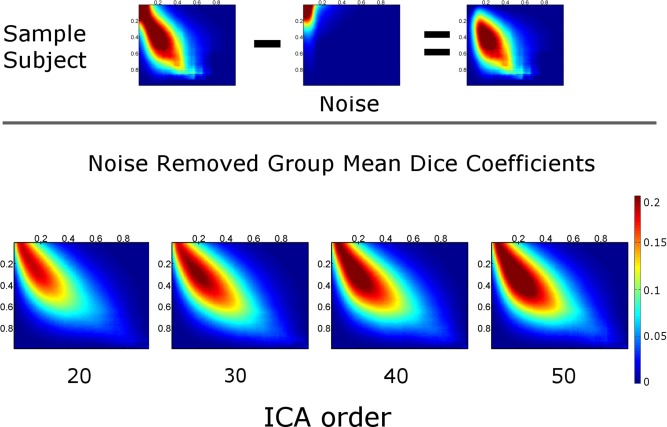
Figure 2.

Dice coefficient matrix. On top, a Dice coefficient map across multiple thresholds is shown for a single subject. From the raw Dice coefficient map (left image), a noise map (middle image) is subtracted to generate a noise‐removed Dice coefficient map (right image). Maps were averaged across all subjects for each ICA order and noise‐removed Group mean Dice coefficient maps are shown on the bottom. [Color figure can be viewed in the online issue, which is available at http://wileyonlinelibrary.com.]
