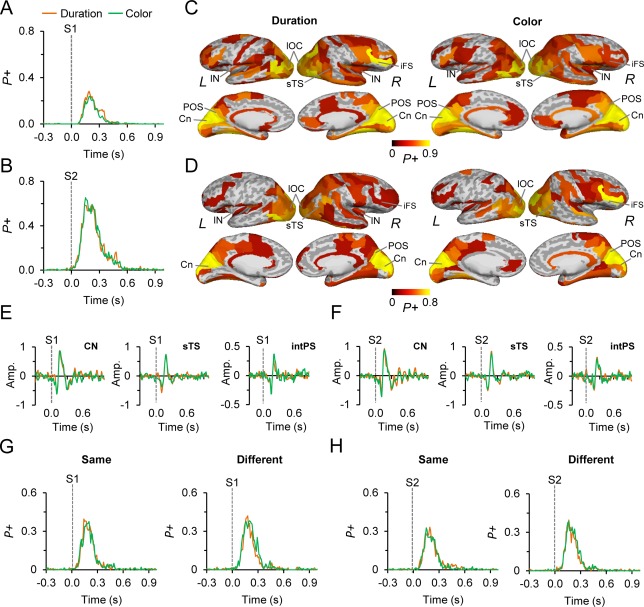
Figure 2.

Evoked responses for S1 and S2. A: The absolute value evoked responses (ER) for S1 of the color and duration WM tasks. The fraction of cortical regions showing positive (P+) modulations in the ER compared to the pre‐cue baseline period (p < 0.01, corrected for multiple comparisons), is displayed on the y‐axis. B: Same as in (A) but for S2. C: Cortical sources of ERs between 0.1 and 0.25 s from S1 onset. ERs were observed in the visual cortical areas, posterior parietal cortices (PPC), superior temporal sulcus (sTS), lateral prefrontal cortex (lPFC), and cingulate (Ci) structures for both tasks. The color defines the proportion of significant TF‐elements in the parcel. D: Same as in (C) but for S2. E: The dSPM amplitude of S1 ERs estimated separately for cuneus (CN), superior temporal sulcus (sTS), and the intraparietal sulcus (intPS). y‐axis displays the dSPM amplitude of the ERs in a given parcel. F: Same as in (E) but for S2. G: The absolute valued evoked responses (ER) for the stimuli in which S2 was same or different compared to S1. Axis as in (A). H: Same as in (G) but for S2.
