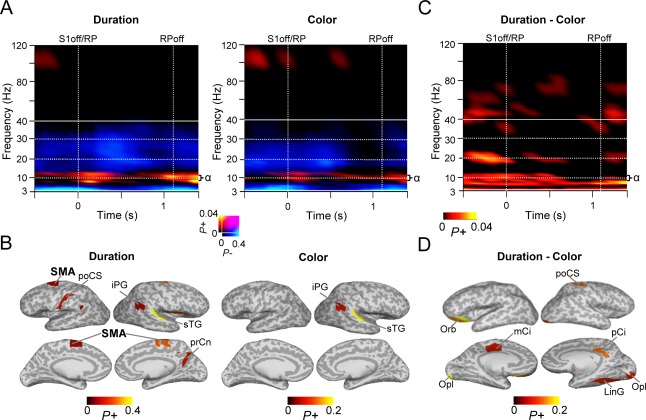
Figure 7.

Oscillation amplitude modulations during the WM RP. A: TFRs showing the fraction of significant positive or negative modulations of oscillation amplitudes during the WM RP compared to the pre‐cue baseline (Wilcoxon signed‐rank test, p < 0.01, corrected for multiple comparisons). A sustained increase in α‐band amplitudes is observed during RP in both tasks. Note that the RP lasts only up to 1.1 s because of the jitter in the duration of S2. Colors as in Fig.3. B: Cortical regions in which RP α‐band (8–14 Hz) amplitudes were observed. Color shows the proportion of significant TF elements between 0.3 and 0.8 s sec from S1 offset for each parcel. C: TFR showing the fraction of parcels with significant difference in the RP amplitudes between the duration and color WM tasks (Wilcoxon signed‐rank test, p < 0.05, corrected for multiple comparisons). θ and α‐band amplitudes were stronger for the duration than for the color WM task. D: Cortical regions showing θ‐α‐band (5–12 Hz) amplitude modulations for duration WM task. See Fig. 3D for abbreviations.
