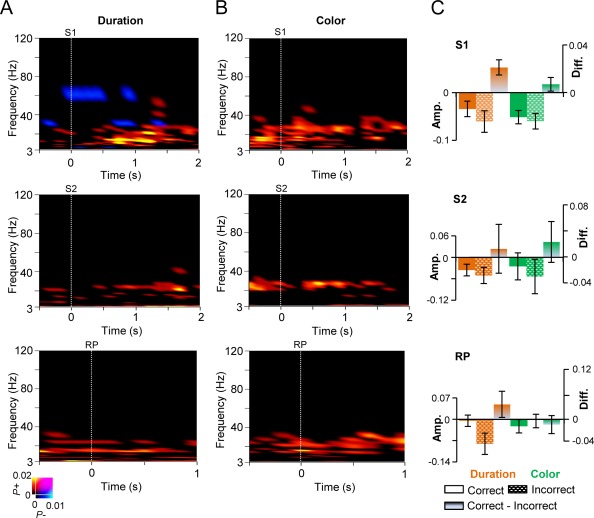
Figure 8.

The strength of oscillation amplitudes is correlated with correct task performance.
A: TFR showing the fraction of significant difference in the strength of oscillation amplitudes between the trials in which the performance was correct compared to that of incorrect trials for the duration WM task for S1, S2, and for the RP (Wilcoxon signed‐rank test, p < 0.01, corrected for multiple comparisons). Warm colors indicate strengthened oscillation amplitudes for the trials with correct response while cold colors indicate stronger amplitudes for the trials with incorrect response. B: Same as in (A) for the color WM task. C: Mean amplitudes (± SEM) for the frequency bands that were correlated with correct responses, from the cortical regions that showed stronger amplitude modulations for the duration task compared to the color task during S1 (see Fig. 3D), S2 (see Fig. 4C) and RP (see Fig. 7D). For S1 data were averaged over 0.3–1.4 s between 8 and 40 Hz bands, for S2, 0.3–1.4 s and 20–30 Hz bands, and for RP, 0.3–0.9 s and 14–30 Hz bands. Data are shown for the correct and incorrect responses as well as the difference between duration and color WM tasks.
