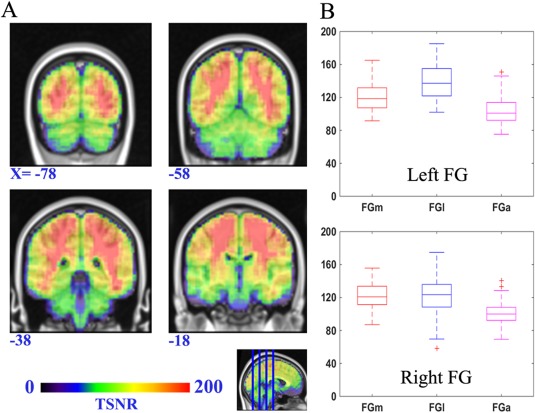
Figure 1.

The SFNR map across the FG. The left subfigure (A) is a map of the SFNR value onto the standard brain template (MNI space) such that warmer colors indicate a higher SFNR value. The right subfigure (B) shows the distribution of the SFNR value for voxels in each FG subregion.
