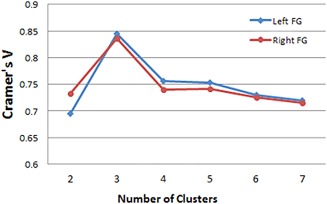
Figure 3.

Using Cramer's V as an indication of the clustering consistency (interval 0‐1), where larger values indicate high consistency and “1” stands for the perfect match, we found that the three cluster solution showed a significantly higher value than other solutions. [Color figure can be viewed in the online issue, which is available at http://wileyonlinelibrary.com.]
