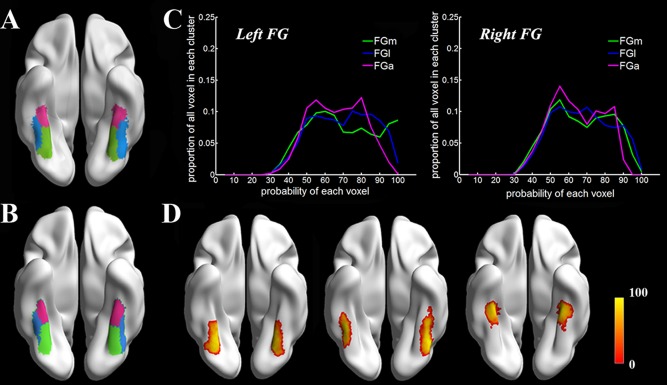
Figure 4.

Our connectivity‐based parcellation scheme of the FG. The results from Dataset 1 and Dataset 2 are presented in Figures 4A,B, respectively. The FGm refers to the medial portion of the FG (green. MNI space, −29,‐57,‐14 for left; 31,‐57,‐15 for right); the FGl refers to the lateral portion of the FG (blue. MNI space, −42,‐52,‐20 for left; 42,‐51,‐21 for right), and the FGa refers to the anterior FG (red. MNI space, ‐ 36,‐32,‐23for left; 35,‐33,‐23 for right). Figure 4C indicates the proportion of voxels in the cluster at a certain probability value, and Figure 4D shows the mapping result of the probability distribution for the three subregions with color map‐encoded probability values.
