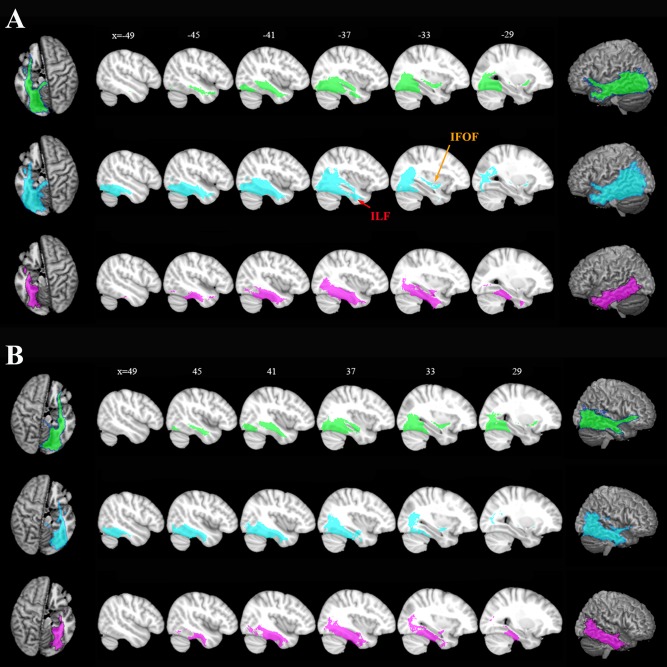
Figure 5.

Population maps of the whole brain anatomical connectivity patterns from the left (A) and right (B) hemispheres. FGm (green), FGl (blue), and FGa (red). The probability fiber tracks were projected back to the anatomical MNI space and averaged for the same cluster. Two major fiber bundles, IFOF and ILF, were identified and marked. The results are displayed using MRIcron. [Color figure can be viewed in the online issue, which is available at http://wileyonlinelibrary.com.]
