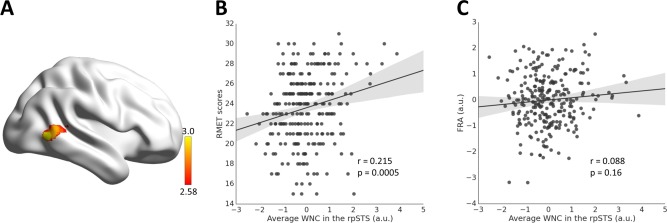
Figure 3.

Correlation between WNC and RMET scores. (A) The WNC in the right posterior superior temporal sulcus (rpSTS) was significantly correlated with the RMET scores. (B) Scatter plot between the RMET scores and average WNC in the rpSTS across participants is shown for illustration purposes. (C) Scatter plot showing correlation between the face‐specific recognition ability (FRA) and average WNC in the rpSTS. [Color figure can be viewed in the online issue, which is available at http://wileyonlinelibrary.com.]
