
Figure 4.
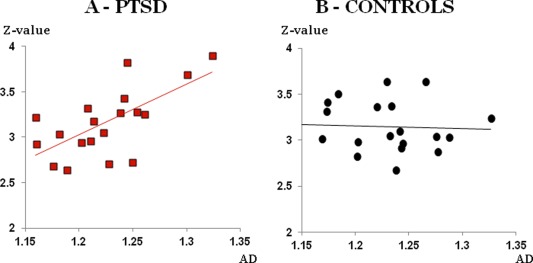
The correlation between functional and anatomical connectivity. Correlation between the z‐scores in the PFC and the AD values in the cingulum were found in PTSD patients (A in red squares) and not in control subjects (B in black circles). [Color figure can be viewed in the online issue, which is available at http://wileyonlinelibrary.com.]