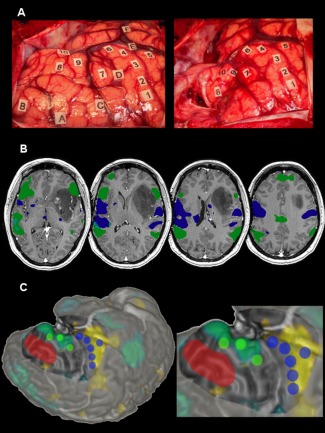
Figure 5.

Illustrative case of stimulation points and ICA connectivity maps overlapping. (A) Intraoperative photograph of a 40‐year old left‐handed female's brain before (left) and after (right) resection. Lettered tags represent tumor boundaries defined with intraoperative ultrasound imaging. Numbered tags represent positive stimulation sites. 1:6 = motor response; 7:9 = language response; 10 = theory of mind response. (B) Axial multislice view of 3DT1 MP‐RAGE preoperative imaging with z‐score > 1.96 thresholded language (green) and sensorimotor (blue) selected independent components overlaid. (C) Surface rendering (operative view) of the patient's brain with language (green) and sensorimotor (blue) stimulation points represented with 5 mm radius spheres. Resected cortex (red) and exposed cortical surface are represented. The z > 1.96 thresholded language IC mask is overlaid in a blue/green color whereas the sensorimotor mask is represented in yellow. [Color figure can be viewed at http://wileyonlinelibrary.com.]
