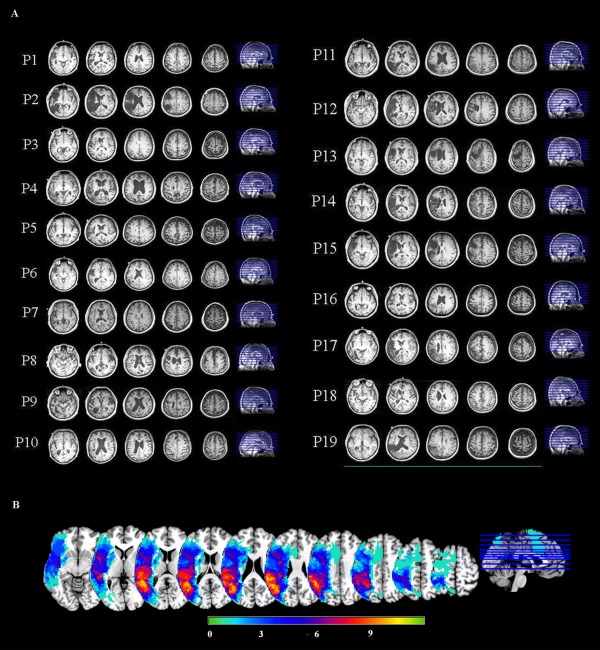
Figure 1.

(A) Selected slices from T1 images of individual aphasic participants showing lesion sites. (B) An overlay of stroke patients' lesion distributions displayed on a template brain in MNI space. Colors represent the number of patients with a lesion in each voxel. Warmer colors indicate areas of greater lesion overlap.
