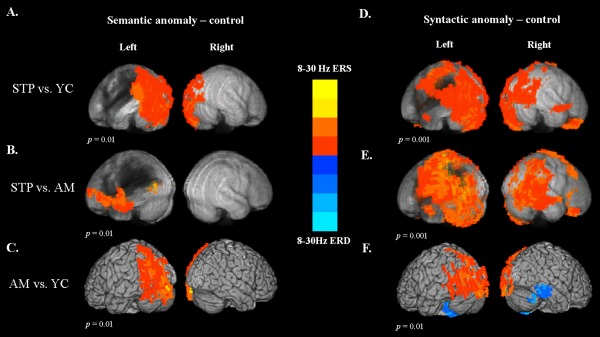
Figure 3.

Between‐group voxel‐wise contrast maps of power changes in the 8–30 Hz frequency range and 0.4–1 s time window after critical word onset. The statistical maps were thresholded at a minimum cluster‐size criterion of 90 voxels and p < 0.01. (A) The subtraction map for stroke patients minus young controls on semantic anomalies (semantic anomalies vs correct sentences). (B) The subtraction map for patients minus older controls on semantic anomalies. (C) The subtraction map for older controls minus young controls on semantic anomalies. (D) The subtraction map for stroke patients minus young controls on syntactic anomalies (syntactic anomalies vs correct sentences). (E) The subtraction map for patients minus older controls on syntactic anomalies. (F) The subtraction map for older controls minus young controls on syntactic anomalies.
