. 2019 Oct 9;127(10):107004. doi: 10.1289/EHP4860

Figure 5.

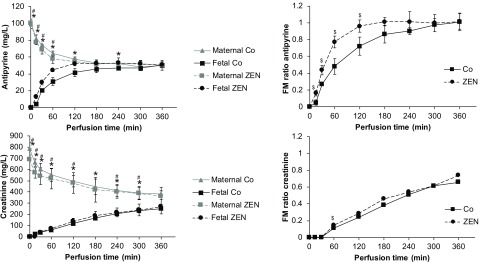
Figure 5 has four graphs. The first graph plots antipyrine values (ranging from 0 to 120 milligrams per liter in intervals of 20) (y-axis) for maternal Co, fetal Co, maternal ZEN, fetal ZEN with standard error of mean across perfusion time (ranging from 0 to 360 minutes in intervals of 60) (x-axis). The second graph plots FM ratio antipyrine values (ranging from 0 to 1.2 in intervals of 0.2) (y-axis) for Co and ZEN with standard error of mean across perfusion time (ranging from 0 to 360 minutes in intervals of 60) (x-axis). The third graph plots creatinine values (ranging from 0 to 900 milligrams per liter in intervals of 100) (y-axis) for maternal Co, fetal Co, maternal ZEN, fetal ZEN with standard error of mean across perfusion time (ranging from 0 to 360 minutes in intervals of 60) (x-axis). The fourth graph plots FM ratio creatinine values (ranging from 0 to 1.2 in intervals of 0.2) (y-axis) for Co and ZEN across perfusion time (ranging from 0 to 360 minutes in intervals of 60) (x-axis).

Perfusion profiles and fetal–maternal (FM) ratio of the reference compounds antipyrine and creatinine. Antipyrine (100mg/L) and creatinine (100mg/L) were added to the maternal circulation in six independently perfused placentas from six different mothers (three placentas were perfused with medium without zearalenone to obtain baseline data (Co) and three placentas were perfused with medium containing ZEN). The concentrations of both reference compounds were measured from the maternal and fetal perfusates by UHPLC-MS/MS at several time points during 6 h of perfusion. Data represent mean±SD of three independently perfused placentas [three control perfusions without ZEN (Co) and three perfusions with addition of ZEN (ZEN)]. p<0.05 is considered statistically significant (* and # denote differences between maternal and fetal concentrations in Co and ZEN perfusions, respectively; $ denotes differences in FM ratio between Co and ZEN). Perfusion data comparing maternal and fetal concentrations were analyzed by unpaired Student's t-test.