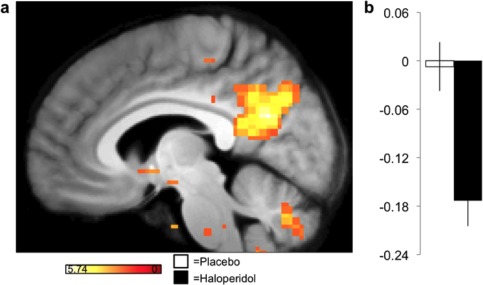
Figure 3.

Functional connectivity from an amygdala seed is reduced in the haloperidol condition compared to placebo. Color‐coded t‐values are superimposed on the average structural image at a display‐threshold of P < 0.001 (uncorrected). The bar graph (b) represents averaged Fisher‐transformed correlation coefficient values between the amygdala seed ROI and the global maximum within the precuneus. Error bars indicate SEM. [Color figure can be viewed at http://wileyonlinelibrary.com.]
