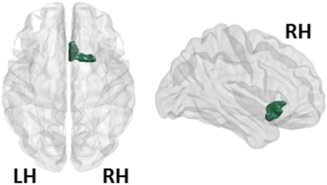
Figure 3.

Local network results (eigenvector centrality). The only region that showed a reduced eigenvector centrality in the de novo PD patients relative to HCs was the right olfactory area. The right olfactory area is represented in green. LH, left hemisphere; RH, right hemisphere. [Color figure can be viewed at http://wileyonlinelibrary.com]
